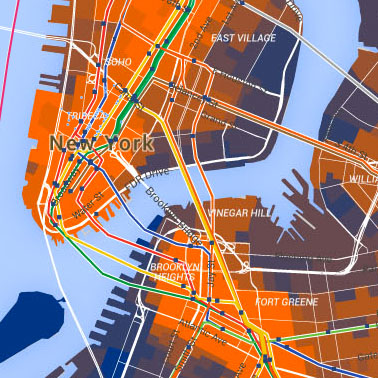
New York City has an extensive transit system connecting the five boroughs and providing rapid connections to the suburbs. In recent years affordable housing and increasing rents have been leading concerns for the city. The city's Housing New York: A Five-Borough, Ten-Year Plan aims to create 200,000 affordable units over 10 years. The New York Urban Scenario analyzes rent-burdened households and affordable housing and provides insight on their relation to transit and other modes of transportation. This analysis can inform decisions on optimal locations for future planned affordable housing.
Currently 1,842 properties (placed between 1989 and 2012) are enrolled in the Low Income Housing Tax Credit (LIHTC) program. These metrics calculate the access to transit, and number of jobs accessible within a 30 minute transit ride by a block group, overlaid with the number of LIHTC units.
This data obtained from NYU’s Furman Center measures average price changes in repeat sales of same properties. The index is reported for the most prevalent type of housing in each community district (single-family homes, 2–4 family buildings, five or more family buildings (including co-op buildings), and condominiums).
9.9
Midtown
47.5%
25.0%
9.3
Clinton/Chelsea
47.5%
25.0%
9.2
Stuyvesant Town/Turtle Bay
49.3%
27.2%
9.0
Greenwich Village/Soho
44.4%
23.6%
8.9
Financial District
44.4%
23.6%
8.9
Central Harlem
47.0%
24.6%
8.4
Upper West Side
41.1%
22.2%
8.3
East Harlem
48.0%
24.6%
8.3
Upper East Side
45.6%
22.8%
8.3
Morningside Heights/Hamilton
46.8%
26.2%
7.7
Lower East Side/Chinatown
49.4%
25.3%
6.8
Washington Heights/Inwood
55.7%
34.4%
Data from NYU’s Furman Center is used to measure access to transit by rent-burdened and severely rent-burdened households. Renters paying 30% and 50% of their income towards rent are classified as rent-burdened and severely rent-burdened households.
Number of jobs accessible within a 30 minute transit ride for limited-English speaking residents.
Proximity of rider-share service Uber’s trip origins to subway and bus station locations is analyzed. Pick-up rates within half mile of transit can help map areas were Uber supplements or in some cases replaces transit.
Broad overview about the metric on the map. This statement probably cannot be anything specific in terms of analysis of the location on the map, but should rather offer a general high-level concept about the metric.

 New York City